… the Tweedy ETFs produced these index-besting results without having any exposure to the very richly valued, so-called “Magnificent 7” stocks.


When paired with our proprietary multi-factor value model, this insider-focused lens has enabled us to build a portfolio of fundamentally sound and undervalued businesses with management teams that think like owners — in our view, a rare yet valuable combination.
Insider + Value ETFs Commentary, Q4 2025Global equity markets continued their unrelenting advance during the fourth quarter with most major market indices once again finishing the year at or around their all-time highs. While the equity market rally has broadened somewhat over the last year, more economically sensitive small- and mid-capitalization companies have rebounded, and non-US equities have seen a resurgence in performance. Even so, a relatively small group of familiar US technology companies continued to account for an outsized share of global index returns.
* Please note that The RBB Fund Trust (the “Trust”) and Tweedy, Browne Company LLC (the “Adviser”), have entered into an expense limitation agreement under which the Adviser has agreed to reimburse Fund expenses to the extent necessary so that the Fund’s total annual operating expenses (excluding interest, brokerage fees, certain insurance costs, and extraordinary and other non-routine expenses) through the period ending December 31, 2027 do not exceed 0.80% of the Fund’s average daily net assets, and also will terminate automatically upon the expiration or termination of the Fund’s advisory contract with the Adviser.
Total Returns are shown net of fund management and operating expenses. The MSCI World Index (in USD) is a free float-adjusted market capitalization weighted index that is designed to measure the equity market performance of developed markets. The MSCI EAFE Index (in USD) is an unmanaged, free float-adjusted capitalization weighted index that is designed to measure the equity market performance of developed markets, excluding the US and Canada. The MSCI EAFE Index (USD) reflects the return of the MSCI EAFE Index for a US dollar investor.
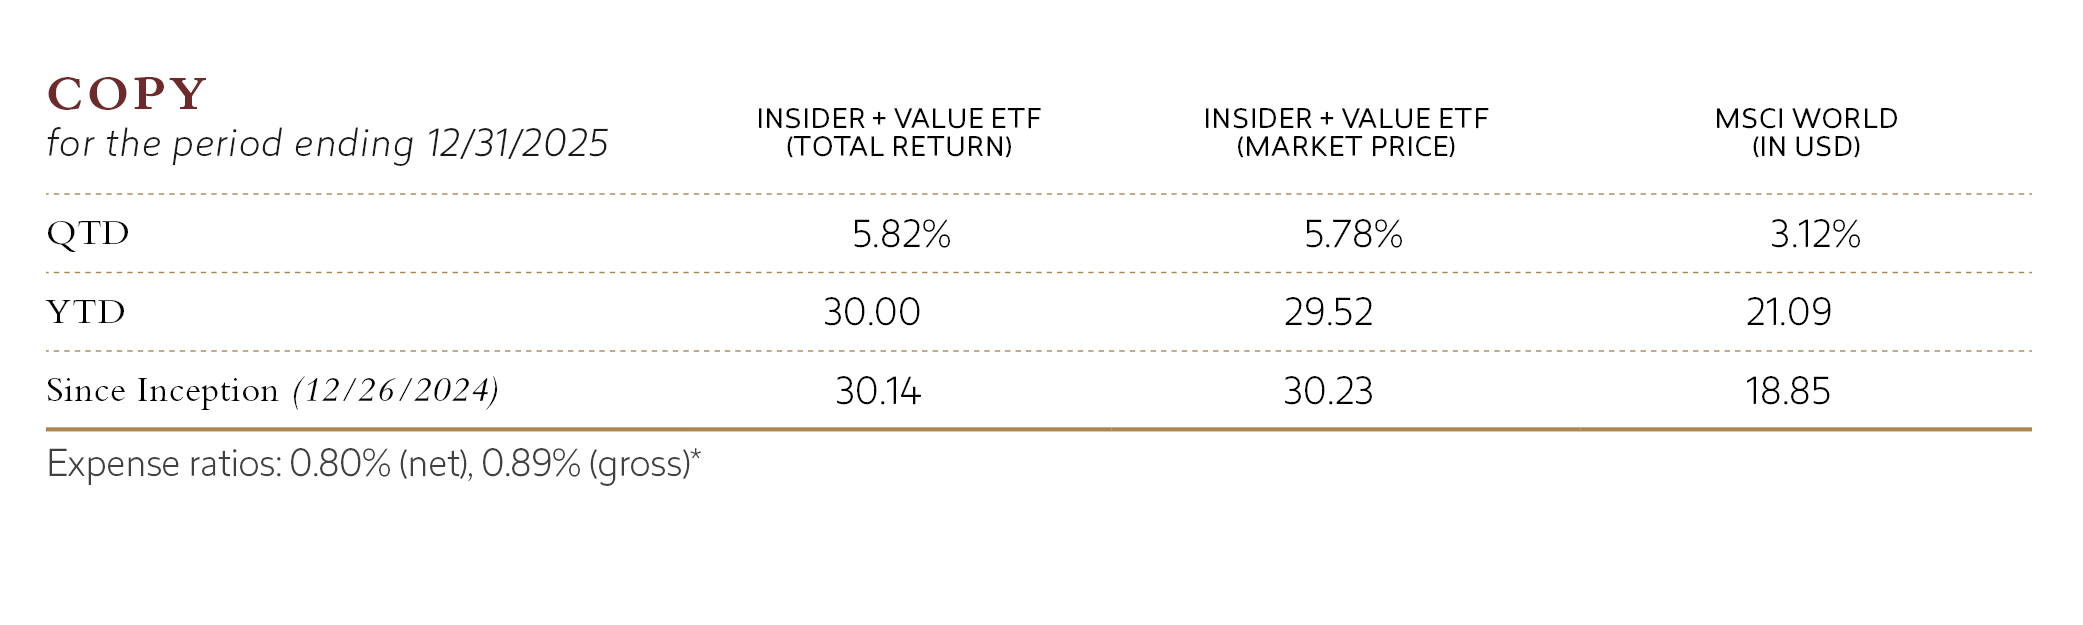
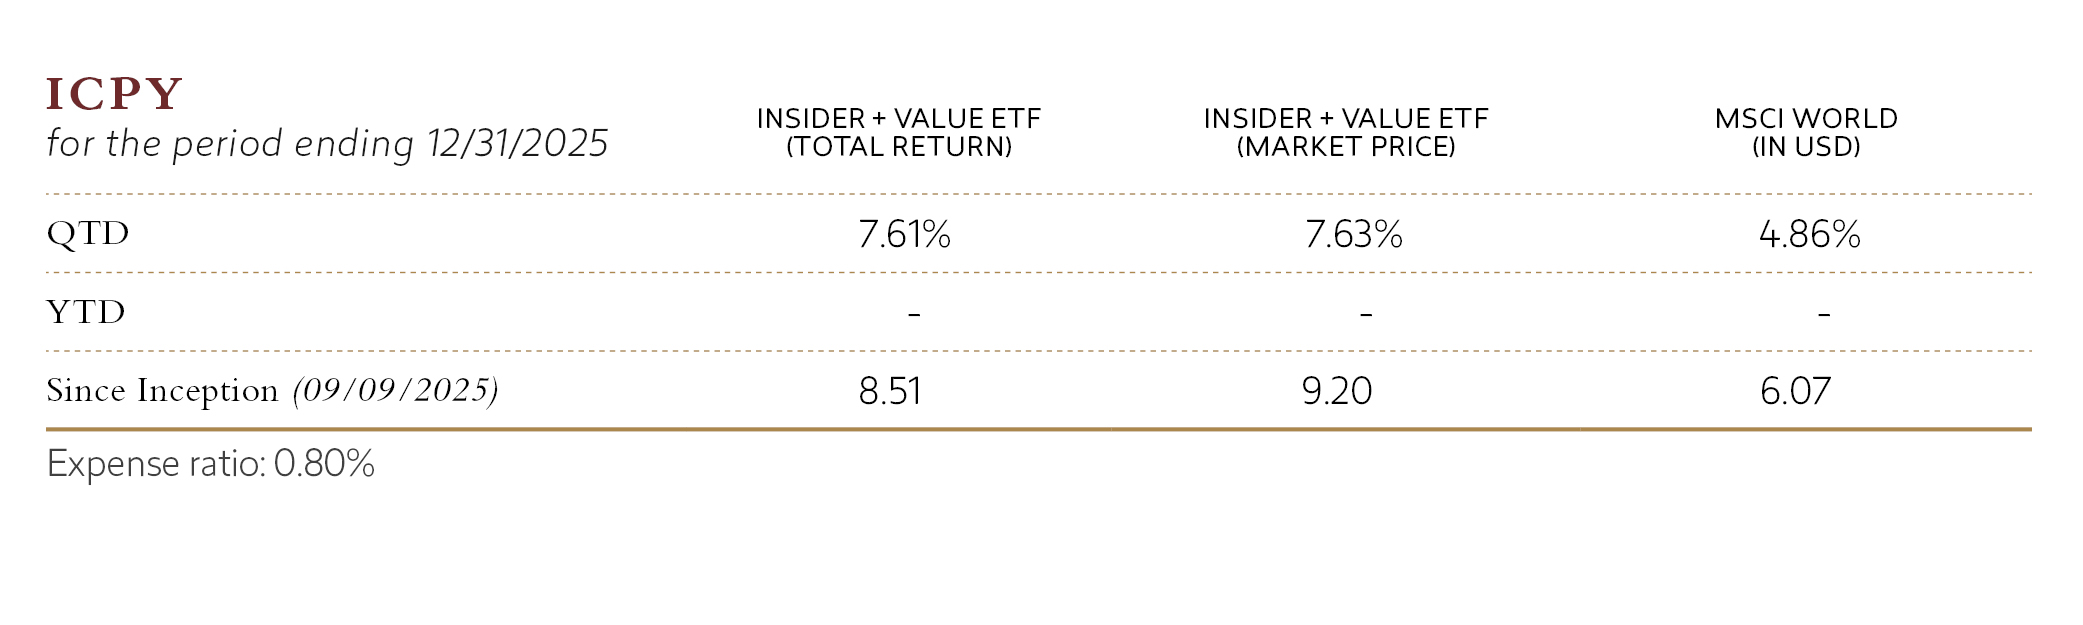
Performance data quoted represents past performance; past performance does not guarantee future results. The investment return and the value of an investment will fluctuate so that an investor’s shares, when redeemed, may be worth more or less than their original cost. The current performance of the Fund may be lower or higher than the performance quoted. For performance data that is current to the most recent month end, click here (COPY) and here (ICPY) or call 1-800-617-0004.
Shares are bought and sold at market price (not NAV) and are not individually redeemed from the Fund. Brokerage commissions will reduce returns. The market price returns are based on the official closing price of an ETF share or, if the official closing price isn’t available, the midpoint between the national best bid and national best offer (“NBBO”) as of the time the ETF calculates current NAV per share. NAVs are calculated using prices as of 4:00 p.m. Eastern time.
While it is still early days for Insider + Value ETF (“COPY”) and International Insider + Value ETF (“ICPY”), we are pleased to report that in this continued “risk on” environment, both ETFs made financial progress on both an absolute and relative basis, besting their respective benchmarks for the quarter, one year, and since-inception measurement periods. In addition, the Tweedy ETFs produced these index-besting results without having any exposure to the very richly valued, so-called “Magnificent 7 stocks .”1 COPY returned 5.82% during the fourth quarter, outperforming the MSCI World Index (the “MSCI Index”), which gained 3.12%. For calendar year 2025, COPY returned 30.00% versus 21.09% for its benchmark, a differential of 891 basis points after fees. Since its inception in late December 2024, COPY is up 30.14%, or over a thousand basis points better than the MSCI Index’s 18.82% return. ICPY, despite launching in the latter part of the year, also posted strong absolute and relative results, producing a 7.61% return in the fourth quarter, compared with a 4.86% return for the MSCI EAFE Index (in USD) (the “EAFE Index”). From its inception on September 9, 2025, through year-end, ICPY returned 8.51%, exceeding its benchmark’s 6.07% return over the same period.
These results have, in part, led to an encouraging response from investors. By the end of the year, COPY’s assets under management reached nearly $200 million. Meanwhile, its younger sibling, ICPY, despite its short operating history, managed to grow its asset base to roughly $10 million.

… the Tweedy ETFs produced these index-besting results without having any exposure to the very richly valued, so-called “Magnificent 7” stocks.
Tweedy’s new ETFs are distinguished not only by their valuation discipline, informed by decades of the firm’s steadfast adherence to a Benjamin Graham-based, price-driven investment philosophy, but also by their emphasis on coat-tailing the purchase behavior of knowledgeable C-suite executives. These are corporate insiders who are buying shares in their own companies or returning capital to shareholders through meaningful share buybacks. When paired with our proprietary multi-factor value model, this insider-focused lens has enabled us to build a portfolio of fundamentally sound and undervalued businesses with management teams that think like owners—in our view, a rare yet valuable combination.
This focus on insider purchase behavior also helps us capitalize on what we refer to as the “insider’s edge,” i.e., the unique insights that senior executives and informed directors can have regarding the prospects for improvement in their company’s condition, and ultimately, its share price. Empirical evidence from academic and professional studies, including our own proprietary research, supports the efficacy of this common-sense approach that pairs insider buying with undervaluation. COPY, which launched at the end of 2024, applies this approach globally, while ICPY, launched in September 2025, focuses primarily on non-US companies.
Across both ETFs, financial holdings were the most consistent contributors during the quarter. Banks in particular performed well, including holdings such as Erste Group, BAWAG, OTP Bank, and a couple of Canadian banks. Materials exposure also added to returns, driven largely by the results of metals and mining holdings, including. Dundee Precious Metals and Boliden. Samsung Electronics, held across both ETFs, was a notable contributor within information technology.
Detractors during the quarter were varied and largely stock specific. Certain media, semiconductor, and industrial holdings lagged, including positions in European media companies and smaller capital goods manufacturers. From a geographic perspective, results were strongest in Canada, the United Kingdom, Sweden, and parts of continental Europe. Italy was a modest detractor. In terms of our ETFs’ market capitalization exposure, returns were driven more by their mid- and larger-capitalization holdings, while the returns of their smaller capitalization companies were more mixed during the quarter.
Both COPY and ICPY began fully hedging their non-US currency exposure late in the quarter. We expect the funds to remain fully hedged going forward, consistent with our view that currency fluctuations are an uncompensated source of volatility that can, at times, obscure underlying stock performance. As always, our focus remains on company fundamentals and valuation over full market cycles.
Both ETFs initiated positions in B&M European Value Retail, Domino’s Pizza Group, First Resources, and Sodexo, driven by a combination of valuation and following the purchasing behavior of informed C-suite executives. Below is a brief rationale for purchase with respect to these newly established positions:
On the sales side, several holdings were eliminated or reduced across both ETFs, including Bank of Montreal, Eurazeo, Persimmon, ProSiebenSat.1, and Wendel. These decisions were driven primarily by valuation considerations, tax loss harvesting, and the availability of more attractive opportunities elsewhere.
Despite the imposition of potentially punishing tariffs, the decline in so-called US exceptionalism, armed conflict in Gaza and the Middle East, and a stubbornly persistent level of inflation leading to the rise of an affordability crisis, capital markets just keep on “keeping on.” This market enthusiasm has led to high, if not excessive, valuations across most asset categories, particularly publicly traded US equities. It’s hard to know exactly what is at the root of this exuberance, but history would suggest that it is some combination of benign economic conditions and “new era” thinking on the part of investors. If it was the emergence of the internet in the mid 1990s, today it most likely is excitement around the prospects for artificial intelligence and its ability to dramatically impact productivity. But as Jonathan Levin and Taylor Tyson recently pointed out in a rather compelling Bloomberg article, “Even the most profound technological revolutions aren’t one-way streets to prosperity.” We suspect this time is not likely to be any different.
Making market calls is impossible, and certainly not the focus of our work at Tweedy, Browne, but we’d be remiss if we did not bring these worrisome signs to the attention of our clients. We cannot know when, but at some point, the popular acronym “FOMO” will likely be replaced by “FOPCL,” or “fear of permanent capital loss.” Unless human nature has changed, when that day comes there may once again be hell to pay, for a while, in capital markets. In the interim, we take comfort in knowing that with an Active Share5 for COPY of 97% and for ICPY of 95%, our ETF portfolios are radically different than their excessively valued benchmark indices.
Ultimately, we fervently believe that a diversified portfolio of undervalued businesses with attractive proprietary Tweedy value scores and where knowledgeable corporate insiders at the company, or the company itself, is making material free will purchases of its shares offers perhaps the best defense against market uncertainty and resultant volatility. If the past is prologue, that should continue to serve us, and our investors, well over time.
We remain humbled by your interest in our new ETFs and thank you for your continued trust and confidence.
Roger R. de Bree, Andrew Ewert, Frank H. Hawrylak, Jay Hill, Thomas H. Shrager, John D. Spears, Robert Q. Wyckoff, Jr. | Investment Committee | Tweedy, Browne Company LLC
January 2026
This material must be preceded or accompanied by a prospectus. An investor should consider the investment objectives, risks, and charges and expenses of the fund carefully before investing. Click here or call 1-800-617-0004 for a copy of the Fund’s prospectus, which contains this and other information about the fund. The prospectus should be read carefully before investing.
All investing involves the risk of loss, including the loss of principal. The Fund’s buyback strategy is based, in part, on the premise that stocks of companies that engage in share buyback purchases are often anticipated to perform well because they typically are a signal that a company’s management believes its shares are undervalued. This positive signal from management may cause the value of such shares to rise. There is no certainty that management of a company undertook a buyback strategy because it believes its stock is undervalued; a company could be using buybacks to increase their price to earnings or other ratios, to alleviate excessive dilution, as a defensive measure, or to cut their own capital expenditures, thereby potentially limiting future growth.
To implement its investment strategy, the Adviser may require access to large amounts of financial data and other data supplied by various data providers. The inability to access large amounts of financial and other data from data providers could adversely affect the Adviser’s ability to use quantitative methods to select investments.
International investing may be subject to special risks, including, but not limited to, currency exchange rate volatility, political, social or economic instability, less publicly available information, less stringent investor protections, and differences in taxation, auditing and other financial practices. Investment in emerging market securities involves greater risk than that associated with investment in securities of issuers in developed foreign countries. These risks include volatile currency exchange rates, periods of high inflation, increased risk of default, greater social, economic and political uncertainty and instability, less governmental supervision and regulation of securities markets, weaker auditing and financial reporting standards, lack of liquidity in the markets, and the significantly smaller market capitalizations of emerging market issuers.
The Fund may invest in derivative instruments, including forward currency exchange contracts, which may be leveraged and may result in losses. Investments in derivative instruments may result in losses exceeding the amounts invested. The Fund’s practice of hedging exposure to foreign currencies where practicable, tends to make the Fund underperform a similar unhedged portfolio when the dollar is losing value against the local currencies in which the Fund’s investments are denominated.
Value investing involves buying stocks that are out of favor and/or viewed as undervalued by the Adviser in comparison to their peers or their prospects for growth. Securities of companies with micro-, small- and mid-size capitalizations tend to be riskier than securities of companies with large capitalizations. This is because micro-, small- and mid-cap companies typically have smaller product lines and less access to liquidity than large cap companies, and are therefore more sensitive to economic downturns.
ETFs are subject to additional risks that do not apply to conventional mutual funds, including the risks that the market price of an ETF’s shares may trade at a premium or discount to its net asset value, an active secondary trading market may not develop or be maintained, or trading may be halted by the exchange in which they trade, which may impact an ETF’s ability to sell its shares. Shares of any ETF are bought and sold at market price (not NAV) and are not individually redeemed from the ETF. Brokerage commissions will reduce returns.
Holdings are subject to change and risk.
DEFINITIONS
The Tweedy, Browne Insider + Value ETF and Tweedy, Browne International Insider + Value ETF are distributed by Quasar Distributors, LLC.