We believe that in a world where inflation remains persistent and interest rates are normalizing at levels far above the zero bound of the not-too-distant past, price once again matters in investing.


… we are encouraged by the resurgence of non-US equity returns and believe the Insider + Value ETF is extraordinarily well positioned for whatever may lie ahead.
ETF Commentary, Q3 2025It was another extraordinarily buoyant period for global equity markets during the third quarter, with both US and non-US equity markets continuing to achieve new record highs as measured by broad market-capitalization weighted indices such as the S&P 500 Index (“S&P 500”), the MSCI World Index and the MSCI EAFE Index. The S&P 500 finished the third quarter up 8.12% and is up 14.83% year-to-date. Popular valuation metrics such as the “Buffett Indicator”1 and the CAPE-Shiller P/E2 are now at or near record highs as of September 30. And this has come on the heels of the S&P 500’s back-to-back 26% and 25% calendar year end returns in 2023 and 2024. Non-US equity markets also were up solidly during the quarter but soared well ahead of US equity returns for the year-to-date measurement period.
In this continued “risk on” environment, the Tweedy Browne Insider + Value ETF (“COPY”) experienced positive returns but trailed its benchmark index for the quarter (5.05% versus 7.27% for the MSCI World Index). Over the year-to-date period, COPY outperformed its benchmark, producing a return of 22.45% versus 17.43% for the MSCI World Index, and since inception the Fund is up 23.12% versus the benchmark’s 15.25% return.

Total Returns are shown net of fund management and operating expenses. The MSCI World Index (in USD) is a free float-adjusted market capitalization weighted index that is designed to measure the equity market performance of developed markets.
Performance data quoted represents past performance; past performance does not guarantee future results. The investment return and the value of an investment will fluctuate so that an investor’s shares, when redeemed, may be worth more or less than their original cost. The current performance of the Fund may be lower or higher than the performance quoted. Click here for performance data that is current to the most recent month end.
Shares are bought and sold at market price (not NAV) and are not individually redeemed from the Fund. Brokerage commissions will reduce returns. The market price returns are based on the official closing price of an ETF share or, if the official closing price isn’t available, the midpoint between the national best bid and national best offer (“NBBO”) as of the time the ETF calculates current NAV per share. NAVs are calculated using prices as of 4:00 p.m. Eastern time.
While US equities performed extraordinarily well over the year-to-date period, the good news for investors in COPY is that non-US equities, particularly European equities, have performed well in US dollars over the same period, producing returns that exceeded those of the S&P 500. We still believe valuations are more compelling outside the US, and as of quarter end, COPY was overweight non-US equities versus its benchmark index (COPY: 71.0% of non-US equities versus MSCI World: 30.4% non-US equities). While currency played a significant role in the outperformance of non-US equities in US dollars, we welcome the value recognition in non-US equities that has occurred year-to-date, which in our opinion, is long overdue.
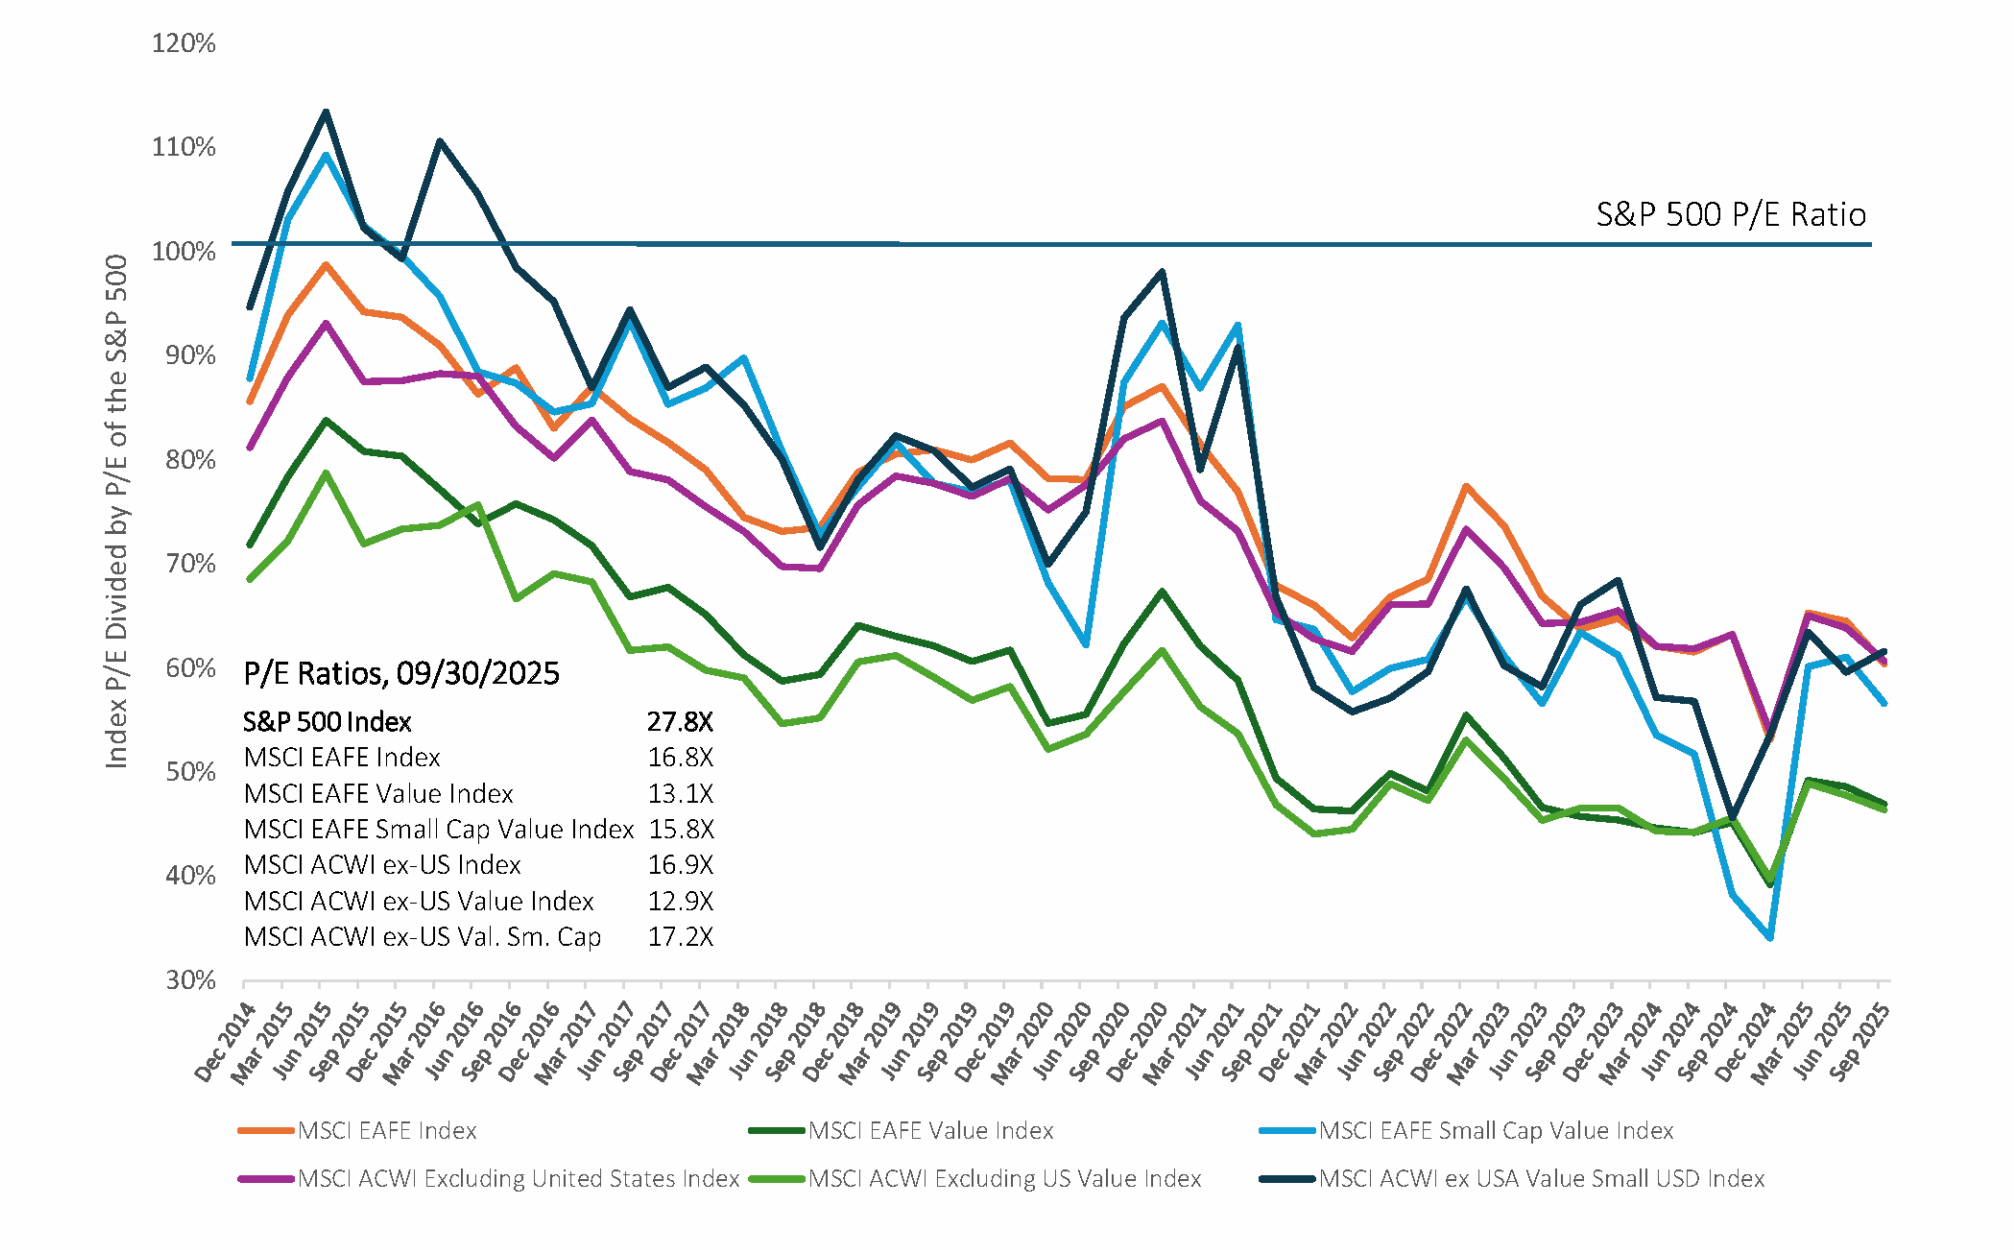
Aside from currencies’ role, it is hard to know for sure what is driving this resurgence in non-US equities. We believe that perhaps the decline in so-called US exceptionalism, and for sure, a weakening US dollar, has played a significant role. In addition, we believe it could partly be due to the prospects for robust defense and infrastructure spending in Europe, and/or the valuation gap that has existed for over a decade and continues to persist between US and non-US equities (see the chart that follows). This gap remains significant despite the outperformance of non-US equities year-to-date. We believe that in a world where inflation remains persistent and interest rates are normalizing at levels far above the zero bound of the not-too-distant past, price once again matters in investing.

We believe that in a world where inflation remains persistent and interest rates are normalizing at levels far above the zero bound of the not-too-distant past, price once again matters in investing.
RELATIVE VALUATIONS OF INTERNATIONAL INDEXES VS S&P 500 TRAILING P/E RATIOS / P/E RATIO OF S&P 500
Tweedy’s new ETF is distinguished not only by its valuation discipline, informed by decades of the firm’s steadfast adherence to a Benjamin Graham-based, price-driven investment philosophy, but also by its emphasis on coat-tailing the purchase behavior of knowledgeable C-suite executives. These are corporate insiders who are buying shares in their own companies or returning capital to shareholders through meaningful share buybacks. When paired with our proprietary multi-factor value model, this insider-focused lens has enabled us to build a portfolio of fundamentally sound and undervalued businesses with management teams that think like owners—in our view, a rare yet valuable combination.
This focus on insider purchase behavior also helps us capitalize on what we refer to as the “insider’s edge,” i.e., the unique insights that senior executives and informed directors can have regarding the prospects for improvement in their company’s condition, and ultimately, its share free price. Empirical evidence from academic and professional studies, including our own proprietary research, supports the efficacy of this common-sense approach that pairs insider buying with undervaluation.
While COPY’s investment approach is largely quantitative and factor-driven, combining insider purchase data and value-oriented statistical metrics to identify investment candidates across multiple geographies and market capitalizations, the research process does employ a light qualitative review to ensure data integrity. This review helps ensure that insider purchases were free-will (voluntary) purchases, and that there were no overarching issues that our model may have failed to address.
As of September 30, COPY was diversified by issue, country, industry, and market capitalization. The portfolio consisted of equity securities from the United States, Europe, the United Kingdom, and across Asia, and it included the more developed of the emerging markets. While the Fund has benefited from this diversified posture, its portfolio constituents bear little resemblance to its benchmark index, and as of September 30 had an “Active Share”3 of 96.9. Its regional, country, industry, and market capitalization exposures also vary considerably from those of the benchmark.
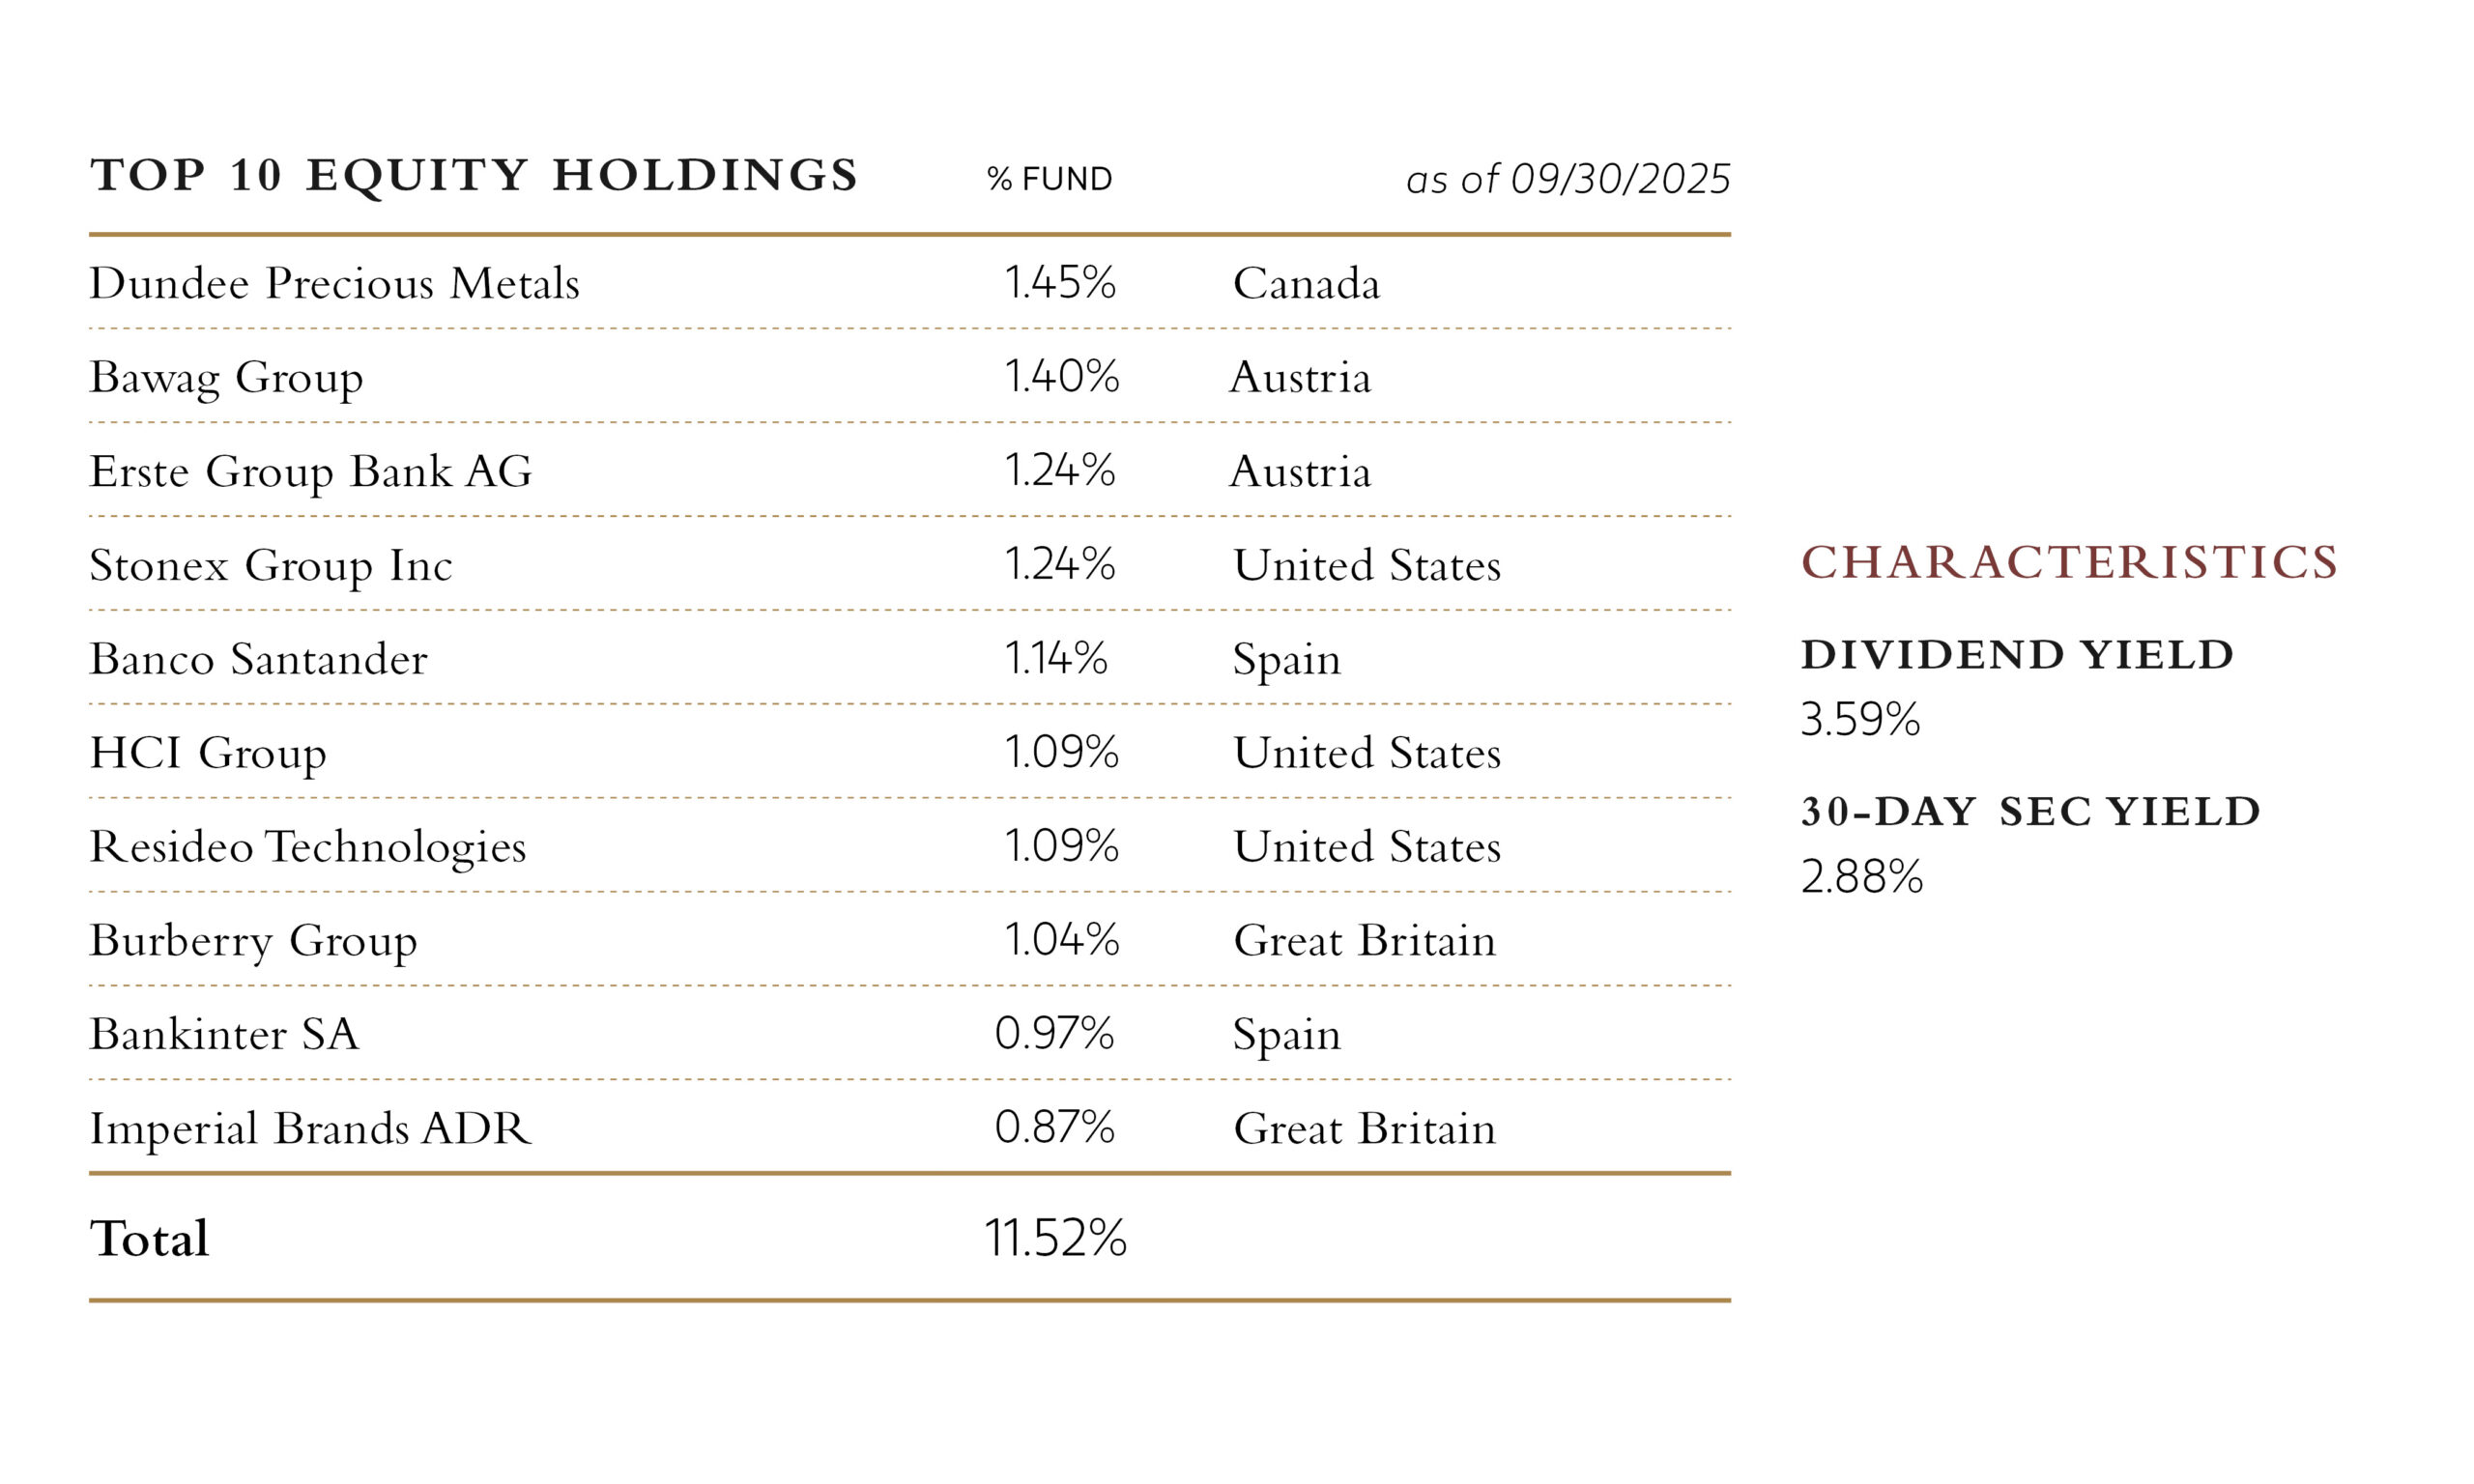
As of September 30, the Fund was invested in 181 individual equities across 22 countries, including the US These holdings spanned 10 sectors, and 48 industries, as classified by GICS4. The largest country allocations were the US (29.4% of equities), the UK (13.7%), and Canada (10.7%), followed by Germany (7.4%), South Korea (6.6%), and Sweden (5.2%).
From a sector standpoint, the Fund’s largest weightings were in Financials (29.2% of equities), Consumer Discretionary (14.7%), and Industrials (11.8%). Notable industry weightings included banks (15.7% of equities), oil & gas (10.0%), insurance (5.4%), capital markets (4.9%), metals & mining (4.2%), media (3.1%), and automobile components (3.1%).
While market capitalizations will vary over time, the Fund currently skews toward small- and medium capitalization companies, with 78% of the equity holdings having market capitalizations of $25 billion or less.
As of quarter end, the Fund had a weighted average price-to-earnings ratio (2026 estimated earnings) of 11.7X, an average annual dividend yield5 of 3.59%, an active share of 96.9%, and assets under management totaling approximately $158.8 million.
For more portfolio characteristics, check out the Insider + Value ETF Factsheet (09/30/2025).
The Fund’s results were led by holdings in the Financials, Energy, and Materials sectors. Financials benefited from strength in US and Canadian banks and insurers. Energy holdings advanced, while Materials names such as diversified miners and metals producers also contributed positively. At the country level, strong results in the United States, Canada, and Spain were partly offset by weaker performance in Germany and France, where a few industrial and media-related holdings detracted.
Among individual holdings, Resideo Technologies, DPM Metals, Ionis Pharmaceuticals, and Samsung Electronics were notable contributors, while Crocs, CNH Industrial, and Prosiebensat.1 Media detracted. We believe these short-term fluctuations do little to alter our long-term investment case.
From a currency perspective, the US dollar strengthened modestly during the quarter, resulting in a slight headwind to overall returns. The Fund’s currency unhedged structure meant that weakness in the euro, British pound, and Canadian dollar dampened results, though this was partially offset by strength in several emerging-market currencies.
During the quarter, we initiated several new positions that, in our opinion, met our criteria for both insider conviction and undervaluation. We’ve highlighted a few below:
Conversely, we trimmed or exited positions in Ligand Pharmaceuticals, U-Haul Holding Company, HighPeak Energy, ProFrac Holding, and Polestar Automotive, largely for valuation reasons or to reallocate capital toward higher-conviction ideas.
These portfolio actions reflect our ongoing efforts to exploit meaningful discrepancies between price and value and to invest where management’s actions align with shareholders.
In early September, we launched the Tweedy, Browne International Insider + Value ETF (ICPY), an international counterpart to COPY. Like the global version, ICPY combines our traditional value discipline with evidence-based insights drawn from corporate insider activity and share repurchase behavior. The Fund applies the same rules-based investment framework but focuses exclusively on non-US companies. In our opinion, ICPY represents a natural extension of our investment philosophy and provides investors with an efficient, globally diversified way to participate in our insider-informed value approach. We are encouraged by the early response to COPY and view ICPY as an important complement for investors seeking long-term international exposure within a disciplined value framework coupled with strong corporate engagement.
For more information, see the International Insider + Value ETF Prospectus
All investing involves the risk of loss, including the loss of principal.
Looking ahead, we are encouraged by the resurgence of non-US equity returns and believe the Insider + Value ETF is extraordinarily well positioned for whatever may lie ahead. If there has indeed been a sea change in our global equity markets favoring non-US equities, COPY will likely continue to participate. However, should global equity markets face a long overdue come-uppance, we take comfort in the Fund’s price driven investment approach and the collateral value backing up the Fund’s portfolio constituents. In our long experience, Tweedy’s value-oriented portfolios have typically gained the most ground against indexes in challenging investment environments. While there are no guarantees that this will hold true for COPY, in the event of a downturn, we are hopeful that pattern will persist. We believe that a diversified portfolio of well-capitalized, competitively advantaged companies purchased at attractive valuations, and informed by the purchase behavior of knowledgeable corporate “insiders” may provide the best defense against market uncertainty and resultant volatility. If the past is prologue, that positioning should continue to serve us, and our investors, well over time.
We thank you for your continued trust and confidence.
Roger R. de Bree, Andrew Ewert, Frank H. Hawrylak, Jay Hill, Thomas H. Shrager, John D. Spears, Robert Q. Wyckoff, Jr. | Investment Committee | Tweedy, Browne Company LLC
October 2025
This material must be preceded or accompanied by a prospectus. An investor should consider the investment objectives, risks, and charges and expenses of the fund carefully before investing. Click here or call 1-800-617-0004 for a copy of the Fund’s prospectus, which contains this and other information about the fund. The prospectus should be read carefully before investing.
All investing involves the risk of loss, including the loss of principal. The Fund’s buyback strategy is based, in part, on the premise that stocks of companies that engage in share buyback purchases are often anticipated to perform well because they typically are a signal that a company’s management believes its shares are undervalued. This positive signal from management may cause the value of such shares to rise. There is no certainty that management of a company undertook a buyback strategy because it believes its stock is undervalued; a company could be using buybacks to increase their price to earnings or other ratios, to alleviate excessive dilution, as a defensive measure, or to cut their own capital expenditures, thereby potentially limiting future growth.
To implement its investment strategy, the Adviser may require access to large amounts of financial data and other data supplied by various data providers. The inability to access large amounts of financial and other data from data providers could adversely affect the Adviser’s ability to use quantitative methods to select investments.
International investing may be subject to special risks, including, but not limited to, currency exchange rate volatility, political, social or economic instability, less publicly available information, less stringent investor protections, and differences in taxation, auditing and other financial practices. Investment in emerging market securities involves greater risk than that associated with investment in securities of issuers in developed foreign countries. These risks include volatile currency exchange rates, periods of high inflation, increased risk of default, greater social, economic and political uncertainty and instability, less governmental supervision and regulation of securities markets, weaker auditing and financial reporting standards, lack of liquidity in the markets, and the significantly smaller market capitalizations of emerging market issuers.
The Fund may invest in derivative instruments, including forward currency exchange contracts, which may be leveraged and may result in losses. Investments in derivative instruments may result in losses exceeding the amounts invested. The Fund’s practice of hedging exposure to foreign currencies where practicable, tends to make the Fund underperform a similar unhedged portfolio when the dollar is losing value against the local currencies in which the Fund’s investments are denominated.
Value investing involves buying stocks that are out of favor and/or viewed as undervalued by the Adviser in comparison to their peers or their prospects for growth. Securities of companies with micro-, small- and mid-size capitalizations tend to be riskier than securities of companies with large capitalizations. This is because micro-, small- and mid-cap companies typically have smaller product lines and less access to liquidity than large cap companies, and are therefore more sensitive to economic downturns.
ETFs are subject to additional risks that do not apply to conventional mutual funds, including the risks that the market price of an ETF’s shares may trade at a premium or discount to its net asset value, an active secondary trading market may not develop or be maintained, or trading may be halted by the exchange in which they trade, which may impact an ETF’s ability to sell its shares. Shares of any ETF are bought and sold at market price (not NAV) and are not individually redeemed from the ETF. Brokerage commissions will reduce returns.
Holdings are subject to change and risk.
DEFINITIONS
S&P 500 is widely regarded as the best single gauge of large-cap US equities. The index includes 500 leading companies and covers approximately 80% of available market capitalization.
MSCI EAFE Index is an equity index which captures large and mid cap representation across 21 Developed Markets countries around the world, excluding the US and Canada. With 795 constituents as of September 29th 2023, the index covers approximately 85% of the free float-adjusted market capitalization in each country.
MSCI EAFE Value Index captures large and mid cap securities exhibiting overall value style characteristics across Developed Markets countries around the world, excluding the US and Canada. The value investment style characteristics for index construction are defined using three variables: book value to price, 12-month forward earnings to price and dividend yield.
MSCI EAFE Small Cap Value Index is an equity index that measures the performance of small-cap securities exhibiting value style characteristics across developed markets worldwide, excluding the US and Canada.
MSCI ACWI ex USA Index captures large and mid cap representation across Developed Markets (DM) countries (excluding the US) and Emerging Markets (EM) countries. The index covers approximately 85% of the global equity opportunity set outside the US.
MSCI ACWI ex USA Value Index captures large and mid cap securities exhibiting overall value style characteristics across 22 Developed and 24 Emerging Markets countries. The value investment style characteristics for index construction are defined using three variables: book value to price, 12-month forward earnings to price and dividend yield.
MSCI ACWI ex-USA Value Small Cap Index is a capitalization-weighted index that measures the performance of global small-cap stocks, excluding the United States, with a focus on value-oriented companies.
EBITA (Earnings Before Interest, Taxes, and Amortization) is a measure of a company’s profitability and value. As the name implies, EBITA adds interest, taxes, and amortization to the earnings equation.
EPS (Earnings Per Share) is a commonly used measure of a company’s profitability. It indicates how much profit each outstanding share of common stock has earned. Earnings growth is not a measure of future performance.
The Tweedy, Browne Insider + Value ETF and Tweedy, Browne International Insider + Value ETF are distributed by Quasar Distributors, LLC.