
There is only one logical reason for insiders to reach into their wallets and buy stock in the open market. They believe the stock price is going higher.


While US-based AI-related companies drove market returns during the quarter, we were heartened to see the advance broaden well beyond the “Magnificent Seven” and other AI-related companies to include a wider range of businesses and smaller-cap companies.
Insider + Value ETFs Commentary, Q2 2026
Despite ongoing geopolitical tensions and a rather fragile cease fire in the Iran/US conflict, the second quarter saw a resumption of the AI inspired advance in US technology stocks. Oil transport began moving again in fits and starts in the Strait of Hormuz, which helped to alleviate concerns somewhat about the potential for spiking oil prices and their derivative impact on inflation and interest rates. Global equity prices responded in a relief rally that continued through quarter-end.
While US-based AI-related companies drove market returns during the quarter, we were heartened to see the advance broaden well beyond the “Magnificent Seven” and other AI-related companies to include a wider range of businesses and smaller-cap companies. Non-US equities also moved up, but trailed their US counterparts. Against this increasingly “risk-on” backdrop, both the Tweedy, Browne Insider + Value ETF (COPY) and the Tweedy, Browne International Insider + Value ETF (ICPY) produced solid absolute returns of 7.36% and 6.27%, respectively, during the quarter. Nevertheless, both ETFs trailed their respective primary benchmarks, reflecting continued underweight exposure to the largest technology companies and portions of the global financial sector that have led much of this year’s advance. However, both COPY and ICPY remain solidly ahead of their benchmarks for the year-to-date period through June 30, producing returns of 14.19% and 12.60%, respectively, versus 9.69% and 9.44% for the MSCI World and EAFE Indices (USD).
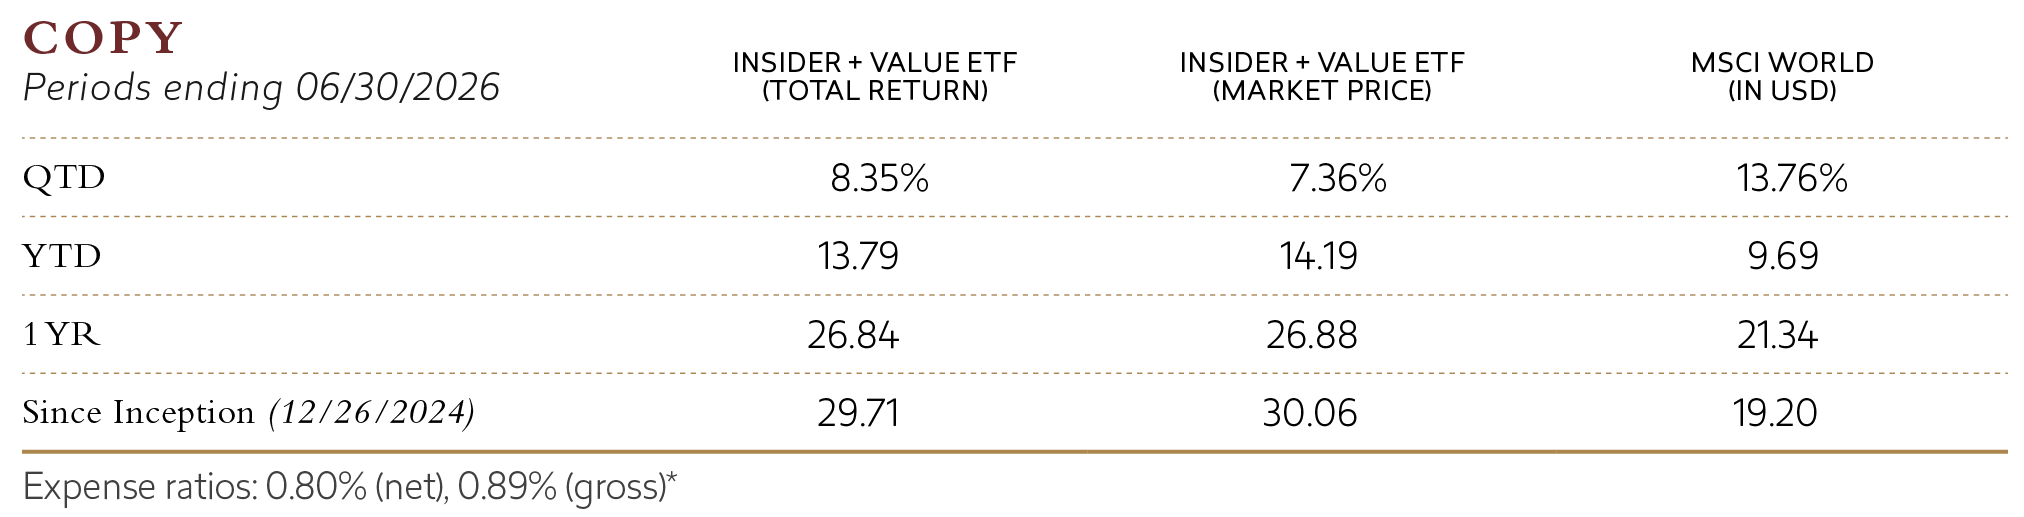
* Please note that The RBB Fund Trust (the “Trust”) and Tweedy, Browne Company LLC (the “Adviser”), as of 12/31/2025, have entered into an expense limitation agreement under which the Adviser has agreed to reimburse Fund expenses to the extent necessary so that the Fund’s total annual operating expenses (excluding interest, brokerage fees, certain insurance costs, and extraordinary and other non-routine expenses) through the period ending December 31, 2027 do not exceed 0.80% of the Fund’s average daily net assets, and also will terminate automatically upon the expiration or termination of the Fund’s advisory contract with the Adviser.
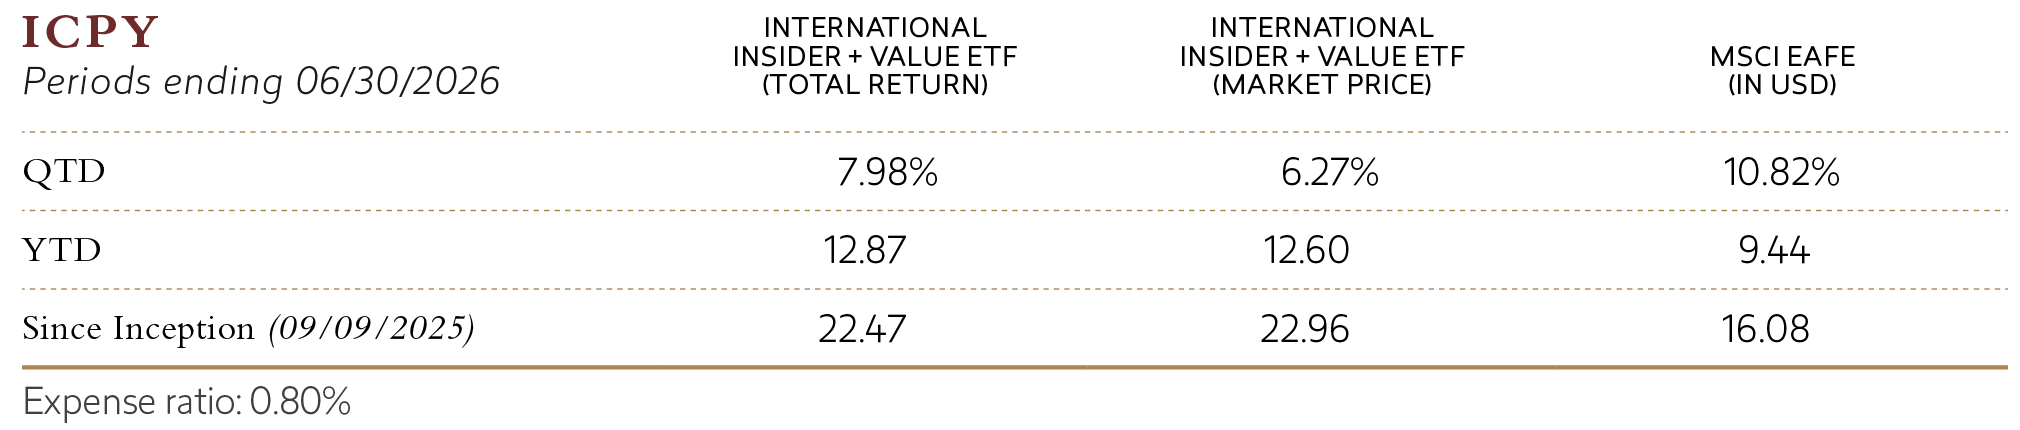
Total Returns are shown net of fund management and operating expenses. The MSCI World Index (in USD) is a free float-adjusted market capitalization weighted index that is designed to measure the equity market performance of developed markets. The MSCI EAFE Index (in USD) is an unmanaged, free float-adjusted capitalization weighted index that is designed to measure the equity market performance of developed markets, excluding the US and Canada. The MSCI EAFE Index (USD) reflects the return of the MSCI EAFE Index for a US dollar investor.
Performance data quoted represents past performance; past performance does not guarantee future results. The investment return and the value of an investment will fluctuate so that an investor’s shares, when redeemed, may be worth more or less than their original cost. The current performance of the Fund may be lower or higher than the performance quoted. For performance data that is current to the most recent month end, click here (COPY) and here (ICPY) or call 1-800-617-0004.
Shares are bought and sold at market price (not NAV) and are not individually redeemed from the Fund. Brokerage commissions will reduce returns. The market price returns are based on the official closing price of an ETF share or, if the official closing price isn’t available, the midpoint between the national best bid and national best offer (“NBBO”) as of the time the ETF calculates current NAV per share. NAVs are calculated using prices as of 4:00 p.m. Eastern time.
While we are pleased with the financial results of our Funds and global equity markets in the first half of this year, we would be remiss if we did not share our increasing concern about rapidly rising equity valuations in the face of a stubbornly persistent inflation and rising interest rates. The over-arching enthusiasm about all things AI related, and the increasing dominance a small group of mega-cap technology companies have unleashed “animal spirits” which cannot help but conjure up memories of the late 1990s, lest we forget the late Barton Biggs’ admonition in March of 2000 that “even monkeys fall from trees.”

There is only one logical reason for insiders to reach into their wallets and buy stock in the open market. They believe the stock price is going higher.
Tweedy’s ETFs are distinguished not only by their valuation discipline, informed by decades of the firm’s steadfast adherence to a Benjamin Graham-based, price-driven investment philosophy, but also by their emphasis on coat-tailing the purchase behavior of knowledgeable C-suite executives. These are corporate insiders who are buying shares in their own companies or returning capital to shareholders through meaningful share buybacks. When paired with our proprietary multi-factor value model, this insider-focused lens has enabled us to build a portfolio of fundamentally sound and undervalued businesses with management teams that think like owners—in our view, a rare yet valuable combination.
This focus on insider purchase behavior also helps us capitalize on what we refer to as the “insider’s edge,” i.e., the unique insights that senior executives and informed directors can have regarding the prospects for improvement in their company’s condition, and ultimately, its share price. Empirical evidence from academic and professional studies, including our own proprietary research, supports the efficacy of this common-sense approach that pairs insider buying with undervaluation. COPY, which launched at the end of 2024, applies this approach globally, while ICPY, launched in September 2025, focuses primarily on non-US companies.
Past Performance is no guarantee of future results.
From a sector perspective, Information Technology was among the largest contributors to returns for both ETFs during the quarter. Favorable performance from semiconductor manufacturers, technology hardware companies and IT services businesses reflected continued investor enthusiasm surrounding artificial intelligence infrastructure spending. Financials also contributed meaningfully as banks, capital markets firms, and insurance companies benefited from improving operating fundamentals and stronger investor sentiment. Consumer Discretionary, Industrials and Utilities also added positively to results. Conversely, Energy was the largest detractor as easing geopolitical tensions and lower oil prices weighed on exploration and production companies. Relative performance was also affected by the ETFs’ continued underweight position in Information Technology compared to their respective benchmark indexes.
At the industry level, semiconductor companies were by far the strongest contributors. X-Fab Silicon Foundries, UMS Integration, and Samsung Electronics benefited from continued demand for advanced semiconductor technologies, while technology hardware, IT services and capital markets companies also generated significant gains. Financial holdings including StoneX Group, IG Group, Banco Santander, National Bank of Canada and Bank of Nova Scotia performed well as investors increasingly recognized improving earnings prospects and stronger capital positions across much of the banking sector. Consumer discretionary holdings such as Watches of Switzerland, Pandora and specialty retailers also made meaningful contributions.
From a geographic perspective, the ETFs benefited from strong performance across several international markets. Singapore, Spain, Belgium and South Korea were among the strongest contributors, while the United Kingdom also performed well, supported by holdings such as Computacenter and IG Group. Samsung Electronics and LG Electronics were notable contributors within South Korea, while several European industrial and financial holdings generated attractive returns. The US was the largest contributing country in COPY, though it detracted on a relative basis due to the large underweighting against the Index. Weakness was concentrated primarily in energy-producing regions and selected emerging markets, including the Philippines, where commodity-related holdings came under pressure.
At the individual security level, Samsung Electronics was again among the quarter’s largest contributors as improving memory pricing and continued investment in AI infrastructure supported record profitability. X-Fab Silicon Foundries, UMS Integration, Computacenter, IG Group and LG Electronics also generated exceptional returns. Additional contributors included Banco Santander, Watches of Switzerland, Pandora, StoneX Group, Acciona and National Bank of Canada.
The largest detractors were concentrated in energy holdings as oil prices declined during the quarter. The performance of Peyto Exploration & Development, Parex Resources, Shell, Repsol, ConocoPhillips and Hafnia all weighed on returns. Other notable detractors included Vodafone, KT Corp, DB Insurance, Vistry Group, Hyundai Glovis and Intrum. Despite these individual setbacks, the portfolios remained broadly diversified across industries, countries and market capitalizations, consistent with each ETF’s disciplined, value-oriented investment process.
Currency movements were a modest tailwind during the quarter. The US dollar strengthened against most major currencies, including the euro, Canadian dollar, and Swiss franc, with more pronounced declines in the South Korean won, Japanese yen, and Swedish krona. As expected, our two currency hedged ETFs were largely insulated from these effects.
Although equity valuations remain elevated in many areas of the global market, particularly in the US, we continue to uncover opportunities where discounted valuations coincide with meaningful insider buying and shareholder-friendly capital allocation (buybacks). Newly established positions during the quarter included:
In addition to the above new purchases during the quarter, COPY and ICPY also established positions in Autotrader Group, the leading online automotive marketplace in the United Kingdom; Krafton, the South Korean video game developer best known for the PUBG franchise; and Metropolitan Bank & Trust Company, one of the Philippines’ leading commercial banks. We also initiated positions in Bank of the Philippine Islands, Sega Sammy Holdings, Transcontinental, Vicat, Vidrala, and Cementir Holding, among others. In COPY, we also established positions in a number of US based companies including Builders FirstSource, Conagra Brands, Everforth, Evertec, Euronet Worldwide, Shoe Carnival, and Zoetis. In each case, these companies appeared to be relatively undervalued as evidenced by a host of value-oriented metrics that comprise the Tweedy Value Score, and insiders, and/or the companies themselves, were making material, free will purchases of their shares at prices at or around the prices paid by our ETFs.
On the sell side, we continued to eliminate positions that no longer met the rigorous valuation criteria required by our proprietary valuation methodology. In some instances, this was because the security had worked out and the company’s stock price had increased to levels that made its valuation score no longer attractive, or it was bumping up against the holding period limit (2-3 years) of our proprietary model. During the quarter, this included companies such as Samsung, UMS Integration, StoneX, X-Fab Silicon Foundries, Cenovus Energy and Mullen Group, among others.
In other instances, positions were eliminated because they had not worked out, and had value scores that were no longer qualifying, or where the original investment thesis had become less compelling or where capital could be redeployed into investments with more attractive valuation metrics offering greater long-term return potential. A number of these eliminations consisted of capital loss generating sales which can be used to offset gains recognized within the ETF portfolio including possible mark-to-market gains from our currency hedges. Loss generating positions eliminated during the quarter included BFF Bank, Malibu Boats, Volkswagen, and JD Sports Fashion PLC, among others.
In all instances involving the elimination of securities from our ETF portfolios, great care is taken to minimize the recognition of capital gains. The ability to distribute in-kind highly appreciated securities without triggering capital gain recognition, and in turn, taxable distributions to shareholders is the true “superpower” of the innovative ETF structure. In COPY and ICPY, we do everything we can on behalf of our shareholders to take maximum advantage of this opportunity to enhance the tax efficiency of our ETF portfolios.

Welcoming Allie Roberts. We are pleased to welcome Allison Roberts to our team. Allie has joined us as the Chief Compliance Officer for both our firm and our Funds, where she will lead our compliance department. Allie brings a wealth of experience from the asset management industry. Prior to joining Tweedy, she worked as the CCO of a registered broker-dealer and registered investment adviser, Grayscale. Additionally, she worked as a compliance professional at Horizon Kinetics, where her experience ran the gamut from ETFs to mutual funds and to hedge funds. Please join us in welcoming Allie to the Tweedy family.
As we mentioned in the introduction of this report, while we are delighted with the financial progress that equity markets and our Funds continue to make, and are heartened by the broadening of the rally, we believe there are also reasons for caution, a few of which we have highlighted below:
While the warning signs above are concerning, we’re not suggesting you abandon sensibly valued publicly traded equities. Today’s market resembles the period before the 2000 tech bubble: technology, media and telecommunications companies traded at highly elevated valuations, but the broader market, for the most part, stayed reasonably valued both in the US and abroad. We see a similar pattern now, with equity returns concentrated in a smaller group of highly valued US technology companies while other sectors, particularly non-US technology, while somewhat elevated, continue to trade at reasonable valuations. History may not repeat, but it often rhymes.
Our Funds remain well positioned by issue, country, sector and industry, with growing exposure to smaller and mid-cap companies. On the whole, these holdings offer much more attractive valuations than US tech giants. Insider buying and corporate buybacks continue to provide valuable signals of undervaluation and the prospect for stronger relative returns. If our worries prove out, and we do get a comeuppance in global equity markets, we believe our Funds should hold up better, and may gain ground on our benchmark indices. If, on the other hand, animal spirits continue to provide exuberant support for equity prices, we’ll likely still participate, even if we don’t outperform.
We remain humbled by your investment in our ETFs and thank you for your continued trust and confidence.
Roger R. de Bree, Andrew Ewert, Frank H. Hawrylak, Jay Hill, Thomas H. Shrager, John D. Spears, Robert Q. Wyckoff, Jr. | Investment Committee | Tweedy, Browne Company LLC
July 2026
This material must be preceded or accompanied by a prospectus. An investor should consider the investment objectives, risks, and charges and expenses of the fund carefully before investing. Click here or call 1-800-617-0004 for a copy of the Fund’s prospectus, which contains this and other information about the fund. The prospectus should be read carefully before investing.
All investing involves the risk of loss, including the loss of principal. The Fund’s buyback strategy is based, in part, on the premise that stocks of companies that engage in share buyback purchases are often anticipated to perform well because they typically are a signal that a company’s management believes its shares are undervalued. This positive signal from management may cause the value of such shares to rise. There is no certainty that management of a company undertook a buyback strategy because it believes its stock is undervalued; a company could be using buybacks to increase their price to earnings or other ratios, to alleviate excessive dilution, as a defensive measure, or to cut their own capital expenditures, thereby potentially limiting future growth.
To implement its investment strategy, the Adviser may require access to large amounts of financial data and other data supplied by various data providers. The inability to access large amounts of financial and other data from data providers could adversely affect the Adviser’s ability to use quantitative methods to select investments.
International investing may be subject to special risks, including, but not limited to, currency exchange rate volatility, political, social or economic instability, less publicly available information, less stringent investor protections, and differences in taxation, auditing and other financial practices. Investment in emerging market securities involves greater risk than that associated with investment in securities of issuers in developed foreign countries. These risks include volatile currency exchange rates, periods of high inflation, increased risk of default, greater social, economic and political uncertainty and instability, less governmental supervision and regulation of securities markets, weaker auditing and financial reporting standards, lack of liquidity in the markets, and the significantly smaller market capitalizations of emerging market issuers.
The Fund may invest in derivative instruments, including forward currency exchange contracts, which may be leveraged and may result in losses. Investments in derivative instruments may result in losses exceeding the amounts invested. The Fund’s practice of hedging exposure to foreign currencies where practicable, tends to make the Fund underperform a similar unhedged portfolio when the dollar is losing value against the local currencies in which the Fund’s investments are denominated.
Value investing involves buying stocks that are out of favor and/or viewed as undervalued by the Adviser in comparison to their peers or their prospects for growth. Securities of companies with micro-, small- and mid-size capitalizations tend to be riskier than securities of companies with large capitalizations. This is because micro-, small- and mid-cap companies typically have smaller product lines and less access to liquidity than large cap companies, and are therefore more sensitive to economic downturns.
ETFs are subject to additional risks that do not apply to conventional mutual funds, including the risks that the market price of an ETF’s shares may trade at a premium or discount to its net asset value, an active secondary trading market may not develop or be maintained, or trading may be halted by the exchange in which they trade, which may impact an ETF’s ability to sell its shares. Shares of any ETF are bought and sold at market price (not NAV) and are not individually redeemed from the ETF. Brokerage commissions will reduce returns.
Holdings are subject to change and risk.
Investors should consult with their tax professional on the impacts of investing.
DEFINITIONS
The Tweedy, Browne Insider + Value ETF and Tweedy, Browne International Insider + Value ETF are distributed by Quasar Distributors, LLC.